In this page, I want to demonstrate how I get the result. First, I need to determine which period of time I want to zoom in. I originally wanted to take the data from 2020. But the data is incomplete, because of the pandemic a lot of movies are postponed. So I take the data from 2009 and 2011 in order to make a comparison. And during the final project check-in meeting, instructor suggests I also take data from 2007. In this way, I can give a more complete comparison. And the reason choose action movie is simply because of the production budget. Typically the action movies cost more to produce. When I try to get the post of the movie, I went to a website called Movieweb. 
This is a perfect website to gather the movie post. But it requires manually screenshot of each post. After I finished screenshot the post. I need a tool to analyze each picture and provide me data. At this time Imagepot totally fit my expectation. This powerful tool can visualize the data with complete data, and generate the analyzed data. But since I am not able to get the full data, at this time I will only use the function of analyzing the brightness. One convince point of Imagepot is directly generating Excel sheet, it can save a bit of time import txt file to Excel and check the correctness. Only a simple function ‘averageif’ can finish the job. After taking the average of the brightness of each year, use the Excel to generate the chart. 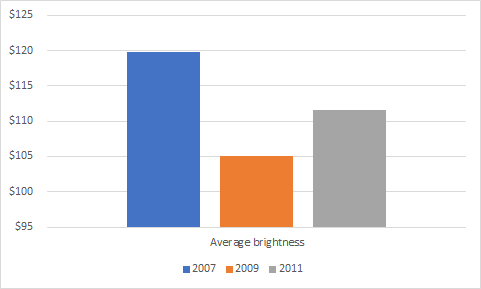
Since I cannot find the article, I leave this chart behind and see this chart as a ‘not peer-reviewed fun fact’.
Move to the next question I want to research is how downturn economic trend will affect the movie box office. In order to get the data of each movie’s box office, I found The Numbers which is a website collect detailed data of movie, including but not limit to proving production budget, box office and TV sales.
After mannualy type the data to the excel, I uploaded the sheet at here, things become straight forward. Use some function and generate the chart.
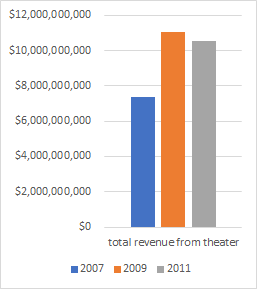

It apparently is out of my expectation. So I went searching for some articles that may explain this situation. Luckily I found an article in JSTOR. This article shows evidence that illustrates only personal disposable income has little effect on spending in cinema. 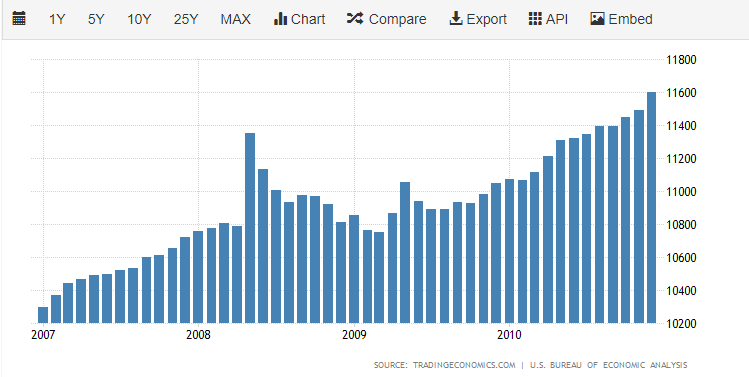
And it appears the personal disposable income didn’t fall a lot at the beginning of 2019. So everything makes sense now.